

A reporting layer built for operators, not spreadsheet cleanup
Build the surfaces every team checks daily: pipeline, response times, rep performance, lead sources, renewals, and executive rollups.
Dashboards
Track performance the moment it changes. Top-line KPIs, target progress, and trend lines stay current without another export cycle.
Funnels
See stage movement, conversion rates, and velocity in one place so teams know where the pipeline slows, leaks, or compounds.
Segments
Go from summary to source fast. Break reports down by owner, channel, stage, region, plan, or any structured field that matters to the team.
Exports
Save the report, share the view, and send updates automatically. Weekly leadership packs and team cadences stop depending on manual prep.

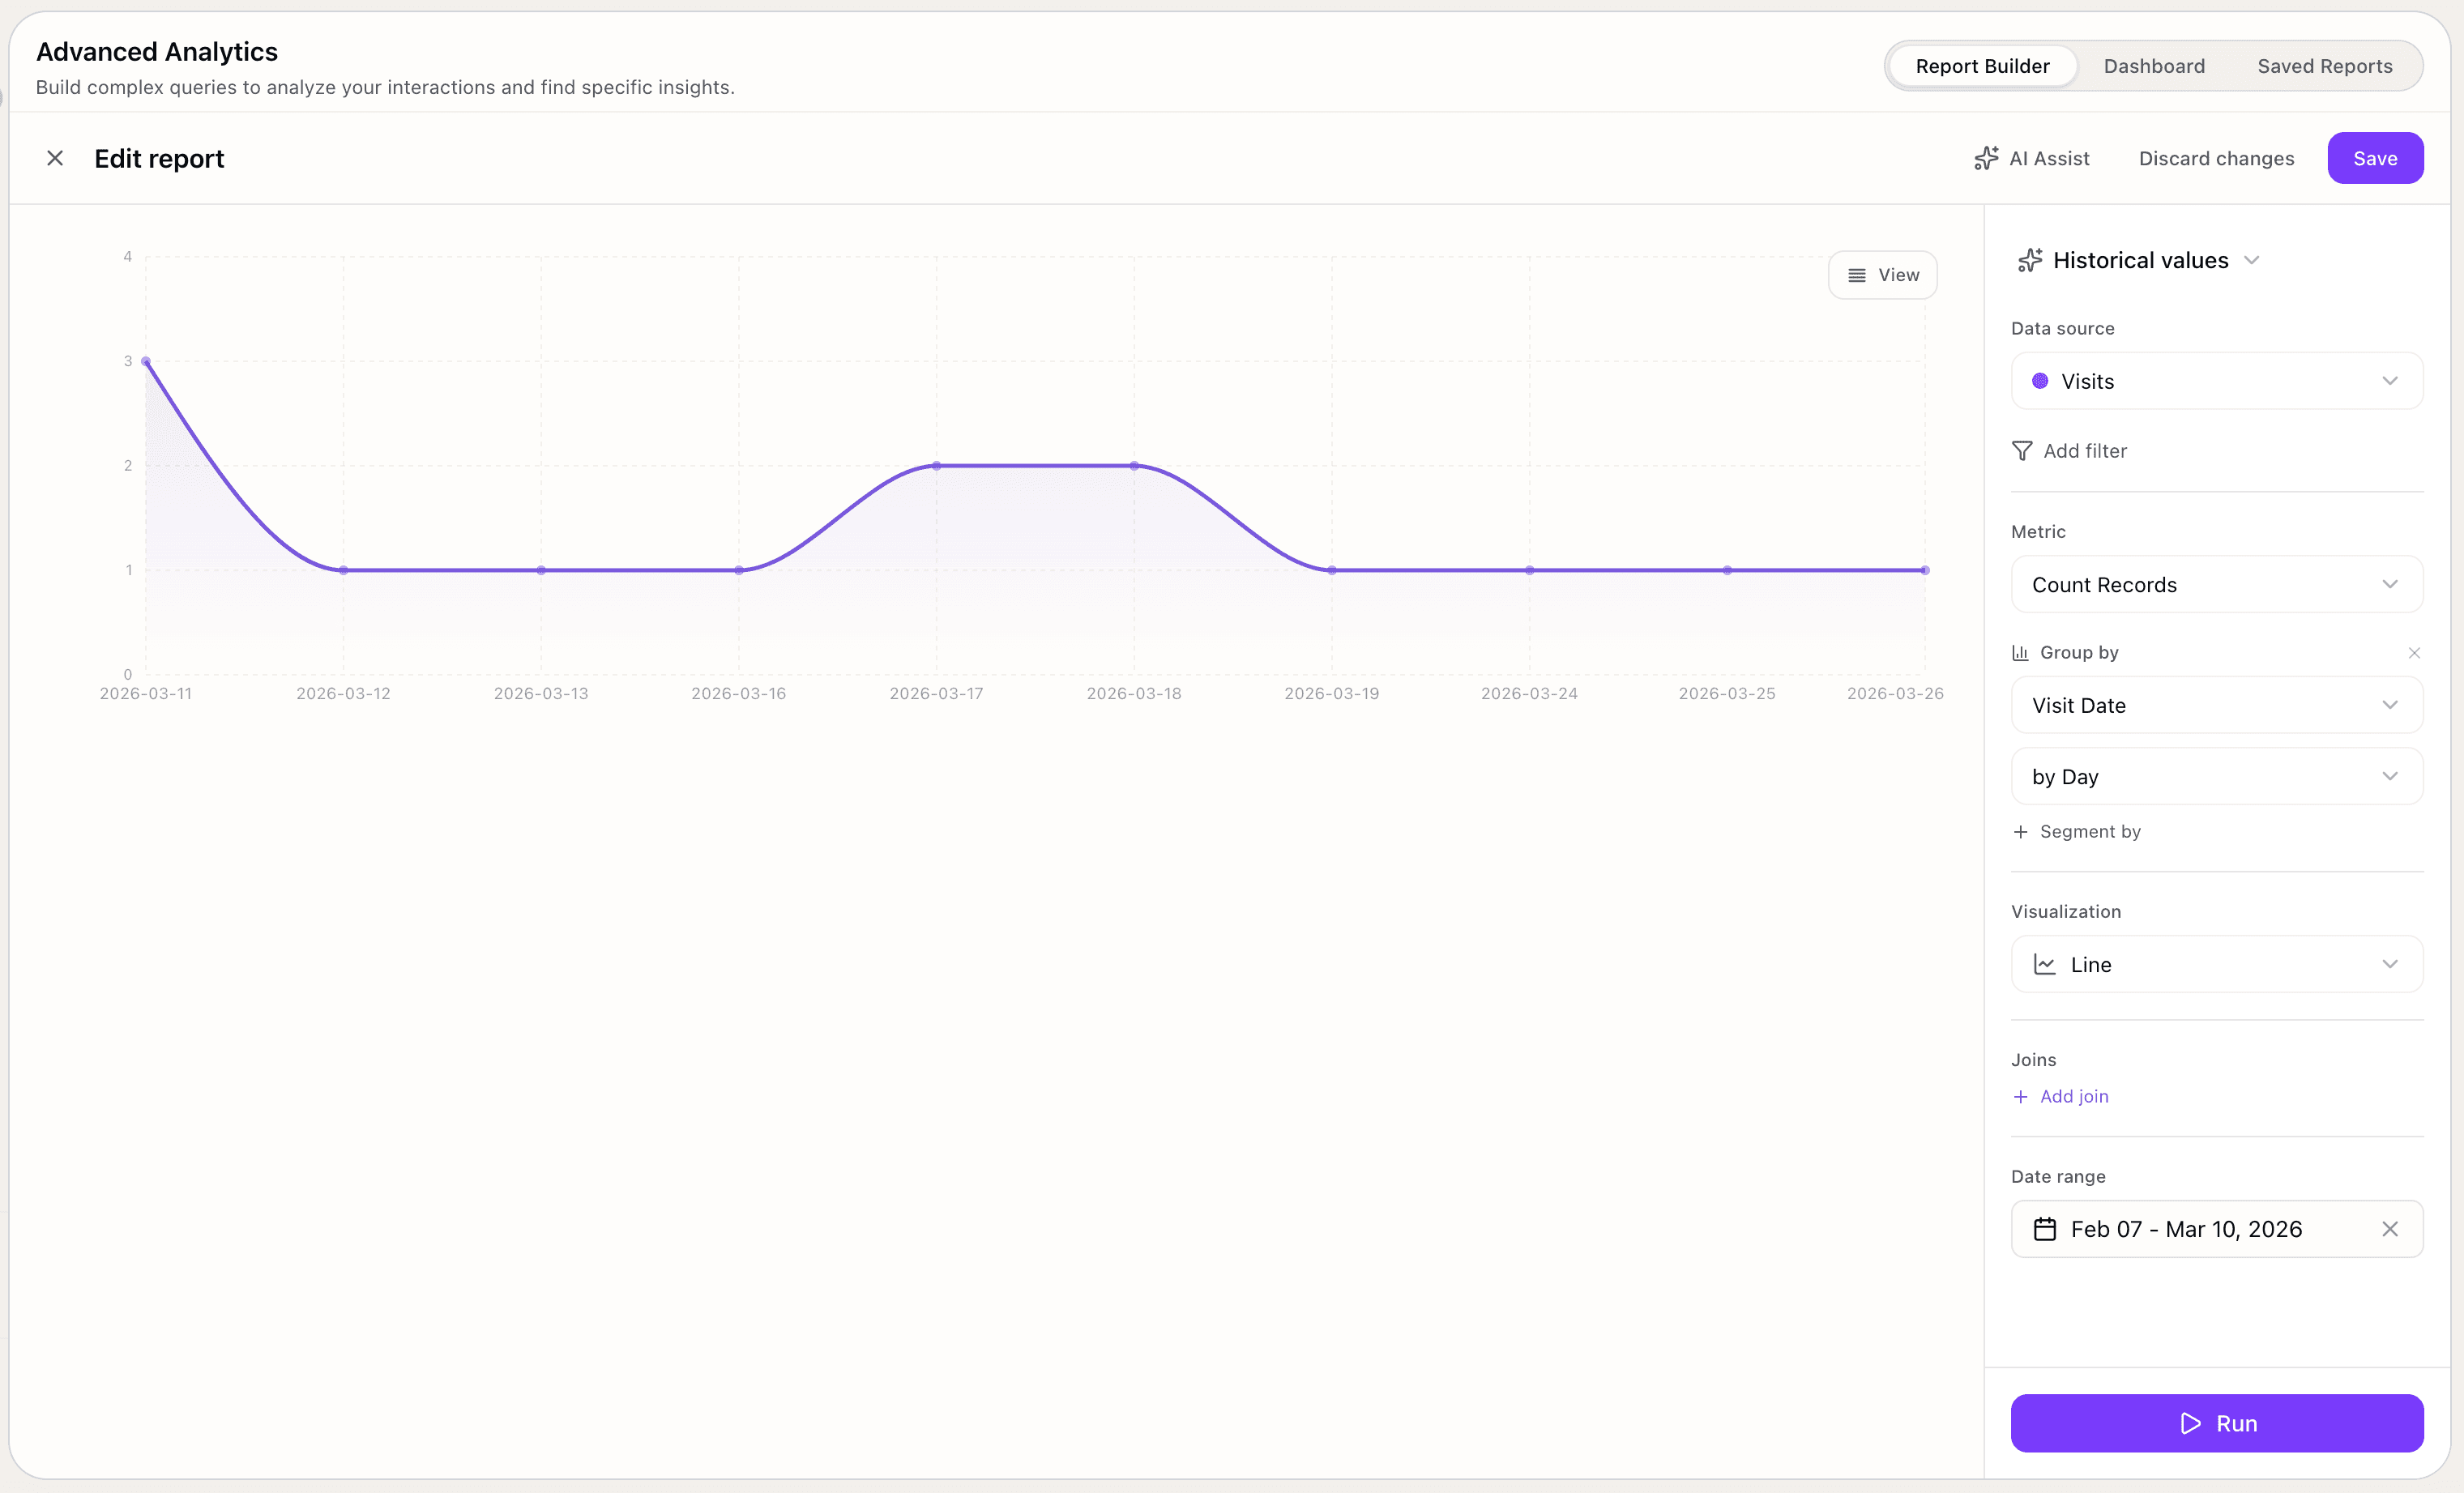
Build insight, historical, and pipeline reports from the same reporting layer
The actual builder supports Insight, Historical values, Funnel, Time in stage, and Stage changed reports, then lets you switch each one into the chart, table, or listing that best answers the question.
Insight mode is built for current-state questions across calls, tickets, customers, deals, and other structured data sources.
The builder already supports the chart shapes teams ask for
From KPI blocks to historical trends and pipeline motion, the live reporting builder can switch the same query into the right visual without rebuilding it.
Metrics and grids
Single metrics, number grids, and progress bars for topline scorecards, compact dashboard blocks, and fast executive snapshots.
Bars and columns
Bar, column, stacked, grouped, and 100% stacked views for comparing owners, channels, teams, plans, or pipeline stages.
Historical trends
Line, area, multi-line, and stacked area views for historical values across days, weeks, and recurring reporting windows.
Pie and donut
Pie and donut layouts for mix, contribution, and distribution questions where composition matters more than sequence.
Funnels and pipeline
Funnel, classic funnel, horizontal funnel, step cards, time in stage, and stage changed views for pipeline motion and bottlenecks.
Tables and deep dives
Tables, table listings, scatter, radar, and treemap views for record-level inspection and deeper comparisons.
Ask the report and generate the graph
Instead of building every chart manually, ask Resonaa a question in plain language and it can explain the change, identify the segment behind it, and generate the graph you need.
Create a graph showing conversion by week and explain why week two slowed down.
I generated the weekly conversion graph. Week two dipped because mid-market conversion fell after pricing objections increased in discovery. Start with the mid-market funnel, then compare loss reasons by owner.
Every team opens a different report. All of them run on the same layer.
Sales leaders, revenue ops, support, and executives each need a different surface. Reporting lets every team see the exact slice they need without rebuilding the data.
Pipeline and source reporting
Track source mix, stage conversion, win rate, and deal velocity without stitching CRM exports together at the last minute.
Rep and manager scoreboards
See attainment, response speed, funnel leakage, and territory movement across teams so coaching and planning happen from the same numbers.
Service and SLA reporting
Watch backlog, response times, reopen rates, and breach patterns by queue, channel, or team before the weekly service review.
Board-ready summaries
Bring revenue, service, and customer operations into one leadership view with saved filters, scheduled delivery, and easy drill-downs.
Questions teams ask before they replace spreadsheet reporting
How reporting differs from dashboards, how flexible the builder is, and what teams can actually share or automate.
Dashboards are the top-line surface. Reporting is the layer that lets teams build, segment, save, and schedule the views behind those dashboards. It is where recurring questions become repeatable reports.
Yes. The reporting page is designed for operators, managers, and team leads. They can build saved views, switch segments, compare windows, and export what they need without waiting on a BI ticket.
Yes. Reports can be sliced by structured fields such as owner, team, source, pipeline stage, plan, market, and other business-specific dimensions already inside your CRM and workflow data.
Yes. Save views for the team, export data when needed, and send recurring report digests on a cadence so leadership and operators stay aligned without manual prep.
That is the point. Reporting sits on top of the same data layer so teams can view customer, revenue, service, and workflow metrics together instead of reconciling separate systems.